Open Maps
New Research Directions and Workflows for Digitized Historical Cartographic Material
This working paper is an outcome of the first international Open Maps Meeting, organized in November 2024 at the Dutch National Archives and National Library, and funded by Open Science NL, KNAW Humanities Cluster, Stichting Pica and Delft University of Technology. It synthesizes general insights from the Open Maps Meeting in a first introductory overview, intended for a broad scholarly audience interested in methodological cartographic and historical mapping advancements. This working paper is primarily based on presentations and input from the expert sessions during the first day of the Open Maps Meeting.
| Author | Affiliation |
|---|---|
| Vincent Baptist | Delft University of Technology |
| Jules Schoonman | Delft University of Technology |
| Thomas Vermaut | KNAW Humanities Cluster |
| Rombert Stapel | International Institute of Social History, KNAW Humanities Cluster |
| Mariëlle Veldhuis | KNAW Humanities Cluster |
| Martijn Meijers | Delft University of Technology |
| Katherine McDonough | Lancaster University, The Alan Turing Institute |
| Rosie Wood | The Alan Turing Institute |
| Kalle Westerling | The Alan Turing Institute |
| Leon van Wissen | University of Amsterdam |
| Manjusha Kuruppath | Huygens Institute |
| Christophe Verbruggen | Ghent University, CLARIAH-VL |
| Iason Jongepier | University of Antwerp, State Archives of Belgium |
| Vincent Ducatteeuw | Ghent University, University of Antwerp |
| Isabella Di Lenardo | EPFL École polytechnique fédérale de Lausanne |
| Rémi Petitpierre | EPFL École polytechnique fédérale de Lausanne |
| Julien Perret | Institut national de l'information géographique et forestière |
Introduction
Over the past decades, large-scale digitization of historical sources by cultural heritage institutions such as archives, libraries and museums, together with international research consortia, have fundamentally changed the possibilities and playing field for humanities-based research. Digital Humanities has become an institutionalized term, with the digital availability of source material guiding the way for posing new research questions in tandem with developing novel research methods. In the Digital Humanities, a focus on increased source availability and methodological innovation has fostered new conceptions of doing research: terms such as distant reading and viewing (Moretti 2013, Arnold & Tilton 2023), as well as thick or deep mapping (Presner, Shepard & Kawano 2014, Bodenhamer, Corrigan & Harris 2015) denote scholars’ engagement with big historical data (Graham et al. 2022), of which the scale, heterogeneity and previous incompatibility now call for computational approaches.
In this context, the Spatial Humanities and Spatial History have been rapidly developing. The digital turn has fostered a spatial one, as maps, plans and related cartographic sources have become more easily and widely available. Simultaneously, GIS tools and techniques for the processing, analysis and subsequent presentation and dissemination of maps have become more commonly used in humanities research. Using GIS, landscape features present on historical maps, such as building plots, roads or waterways, can be vectorized on the original source material. Scanned and digitized historical maps in raster format are also frequently used as base layers onto which other layers of geospatial information can be overlaid.
The vectorization and layering approaches common to GIS have resulted in many research endeavors extracting and aggregating information from varied archival sources, to subsequently link and project the obtained data onto historical maps. Address books and gazetteers are some of the source types most commonly used in this respect (Di Lenardo et al. 2019, Hermenault 2024), while cadastral maps and city atlases have provided the base layers for large-scale mapping projects, such as the Dutch HisGIS initiative. The potential of large-scale data extraction combined with geospatial processing has previously prompted visions of establishing ‘Time Machines’ across Europe, to research historical urban contexts with rich archival documentation, from Venice, Amsterdam and Antwerp to Paris. These constitute efforts to reconstruct the past, or at least parts and layers of its complexity, based on historical material and by linking it to 3D and 4D modeling. Within this European framework, the Time Atlas currently serves as a shared infrastructure for connecting, contextualizing and comparing the heterogeneous datasets produced by local Time Machines. In addition, the scaling up of data extraction from structured historical sources, and the automation of vectorization and related GIS processes, have become focal research points in their own right.
Vectorizing Maps - HisGIS
HisGIS is a large-scale research and citizen science initiative to digitize and disseminate the oldest Dutch cadastre. Initially set up at the Fryske Akademy in the Netherlands, the HisGIS project and infrastructure are currently run at the KNAW Humanities Cluster and the International Institute of Social History. HisGIS offers a research infrastructure that provides full access to the Dutch historical cadastre of 1832. The original source material comprises 17.000 maps with associated cadastral registration data. The cadastral parcel is used as the main ‘atom of space’ around which HisGIS’ digitization efforts are set up. Parcels on the original maps are digitally vectorized and linked to transcribed registry data, with the help of a volunteer community.
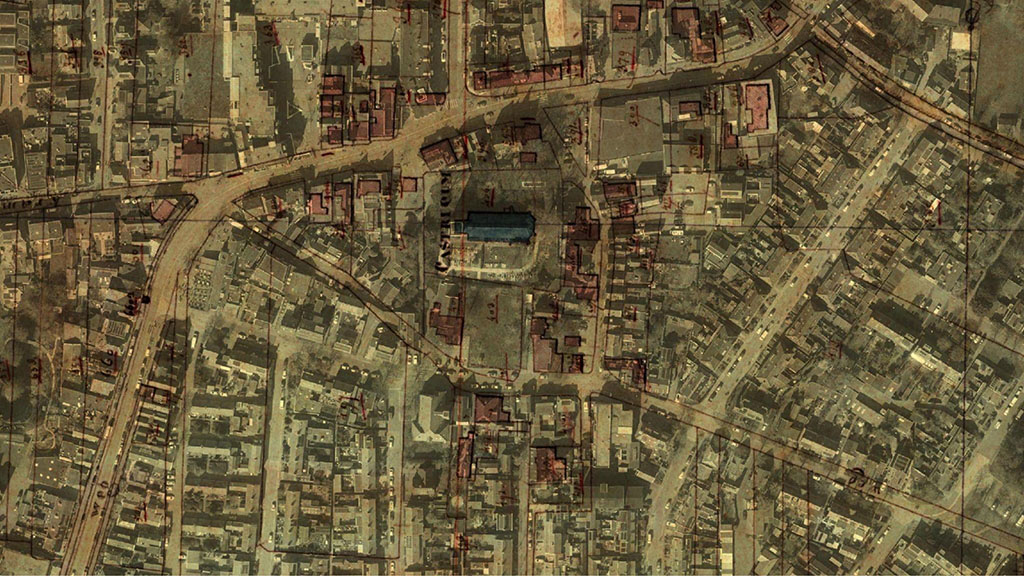
Figure 1: Example of vectorized cadastral map from HisGIS overlaid on OpenStreetMap
The resulting HisGIS base layers are used in various research projects, such as the Amsterdam Time Machine (Noordegraaf et al. 2019), to connect other geospatial data layers to. A main challenge in the HisGIS project is that of managing scalability: the 17.000 maps comprise over three million cadastral parcels, spread across approximately 140.000 register pages. Close to 600 scholarly publications already use or refer to the HisGIS project data. This extensive reach and user base is one of the reasons the Dutch Cultural Heritage Agency and the Ministry of Education have supported an extensive investment in HisGIS to continue improving the project’s durability and data accessibility.
The process of vectorization privileges capturing the ‘real’ or spatially traceable features on historical maps, however, while often ignoring other cartographic elements, such as text or iconography on maps. Reflecting ideas from the critical history of cartography and mapping, new tools and methods have therefore started moving beyond traditional GIS frameworks and processes, to enable alternative approaches to collect data from and interpret historical maps. As will be discussed later, MapReader, for example, addresses these concerns and opens new avenues for asking questions about digitized map collections. HisGIS, too, has started opting for a more integrative approach to digitizing its cadastral sources, in effect creating a mixture between vectorized maps of parcels, a gazetteer and a georeferenced historical route network.
Georeferencing Maps - IIIF & Allmaps
In order for digitized historical maps to be meaningfully used and linked to the geographical areas they depict, image pixels need to be connected to a geographic coordinate system. This process is called georeferencing, during which control points are identified and established between map images and modern map base layers, such as OpenStreetMap. When vectorized HisGIS maps are georeferenced, the historical cadastral depictions spatially correspond with modern maps of the Netherlands. Until recently, georeferencing was most often done through built-in GIS software functionalities or with online web services. In both cases, a new, georeferenced map file would be produced for personal use.
Such workflows raise various issues and inefficiencies, however, particularly from Open Science perspectives, namely: 1) personal software or web accounts are needed for this way of working; 2) different researchers will often inevitably georeference the same map sources independently from one another; 3) the georeferencing process results in derivative files for personal download and storage, which get duplicated when shared further; and 4) scalability issues arise in situations where numerous, related maps need to be georeferenced together.
HisGIS has long worked with a custom-built georeferencer to tackle some of these issues. This internal HisGIS tool also allowed to directly link maps in a map series to each other. To make the functionalities of this georeferencing tool available for the long term and to a wider audience, HisGIS has partnered with the open-source platform Allmaps to work on a new version of the tool. Allmaps has recently been developed by TU Delft Library and independent developers, based on the open data standards of IIIF.
IIIF, or the International Image Interoperability Framework, is a set of open data standards and models to enhance access and presentation of digital objects, such as map image files. IIIF is developed by a global community of data curators, developers, researchers and cultural institutions. IIIF helps overcome the scatteredness and duplication of digital objects by producing ‘manifests’ or digital blueprints of source material, with which to anchor their specific features. An important piece of information to present historical maps in particular is metadata on their georeferencing, linking map images to geographic coordinates. Stimulated by recent developments in the Spatial Humanities and new initiatives such as Allmaps, IIIF has adopted a Georeference Extension for its manifests. The result is that historical maps can now be georeferenced and displayed directly in web browsers when using the IIIF-based Allmaps resources. Ultimately, this for instance also allows for all control points and related data of HisGIS’ georeferenced cadastral maps to be transferred to the Allmaps environment as open, reproducible data.
Built up around the open data standards of IIIF, Allmaps provides better access, presentation and exploration of digitized maps. The platform was founded by TU Delft Library and independent developer Bert Spaan, and among others follows from previous map digitization and exploration efforts at the New York Public Library. Allmaps provides a web environment in which IIIF-backed maps and other cartographic material can be showcased and further disseminated. To stimulate a new, open workflow for georeferencing maps, Allmaps provides a step-by-step process to select map images, establish map control points, and display the resulting georeferenced maps in the browser, with links to original sources and export possibilities to GIS software.
Allmaps also allows to work with and display larger historical map series. Similar to large-scale processes of vectorization, simultaneously georeferencing and digitally presenting a collection of hundreds or thousands of maps raises issues on how to automate these processes. In the GIS Technology group at TU Delft’s Faculty of Architecture and the Built Environment, a new piece of software, MapEdge, has recently been developed in relation to Allmaps, focusing on automatic detection of map sheet corners (Meijers & Schoonman 2024). In this process, the sheet index of historical map series, which describes a map series’ original order and logic and thus also the coordinates of the sheet corners, becomes an indispensable piece of information. Linked to the Allmaps platform, technical innovations such as MapEdge currently stimulate new projects. One is the new Watertijdreis with the Dutch Cultural Heritage Agency, a twin version of the well-known Dutch map browsing platform Topotijdreis, built up around national water and river map series.
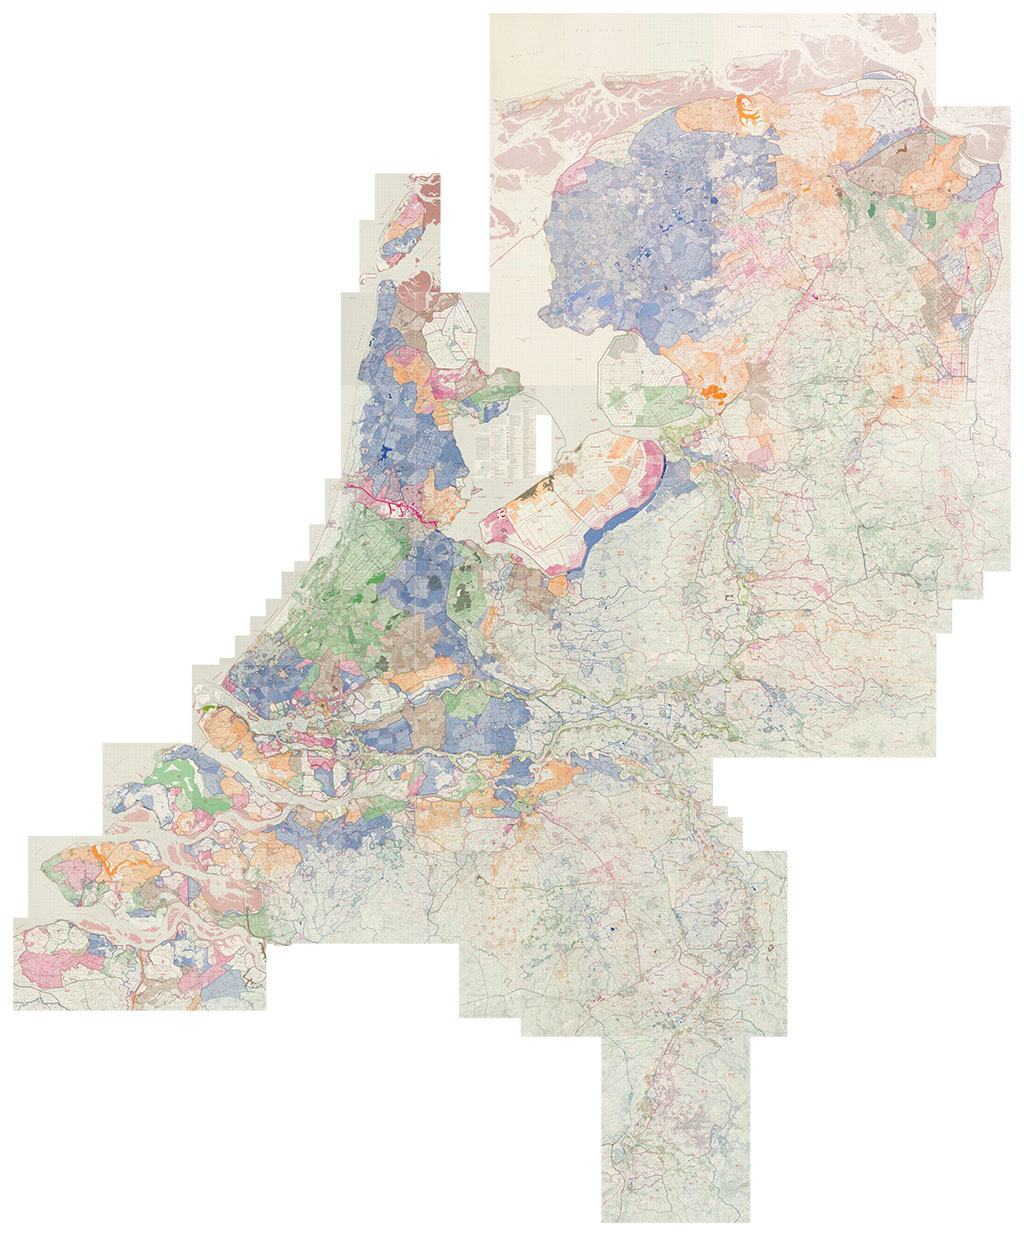
Figure 2: Impression of georeferenced Dutch Waterstaatskaart series
With historical maps and map series becoming digitally available in better and easier ways, researchers can now also focus more on investigating map content itself. The developments sketched out so far give an impulse to analyze historical map features in more encompassing ways. Going beyond viewing and browsing, digitized maps can serve as research data in their own right. This perspective stimulates endeavors to identify and compare what is depicted and represented on maps. Supported by computer vision and machine learning principles, findings can then be extrapolated to larger collections of source material. Two initiatives taking the lead in this line of research are MapReader and Cartonomics.
Annotating and Analyzing Maps - MapReader
MapReader is an open-source Python-based, and IIIF-supporting, set of computer vision pipelines, with which large numbers of map images can be analyzed (Hosseini et al. 2022, Wood et al. 2024). Originally started in the context of the Living with Machines project, it has since been developed by scholars at the Alan Turing Institute and Lancaster University. MapReader provides a workflow that allows users to import collections of map images and divide each map into smaller units or ‘patches’. These smaller units of analysis can subsequently be annotated according to the presence or absence of particular visual features, e.g. whether railways are present or not on selected map patches. Based on this initial annotation process, machine learning algorithms built into the MapReader pipeline can be trained to classify the contents of patches for entire map collections.
With this workflow, MapReader enables the discovery of patterns across maps and other kinds of geospatial sources, as its project team has for instance done for early railroad infrastructure across the UK (Rhodes et al. 2025). Most recently, MapReader has been expanded with another pipeline that specifically focuses on text spotting (i.e. text detection plus recognition) on maps. This enables large-scale use of text on maps as research data for the first time (McDonough et al. 2024), and has also been implemented as a new search feature for the David Rumsey Map Collection.
MapReader is therefore not simply a tool that replicates analogue research practices, and it also does not assume that map contents are objective. Instead, it reconfigures the experience of working with historical maps, while embracing critical theories about the nature of maps and landscapes of the past (cf. Nelson 2024). The MapReader pipelines are in that sense both accessible technical contributions and epistemological starting points for the new, humanities-driven field of computational map studies.
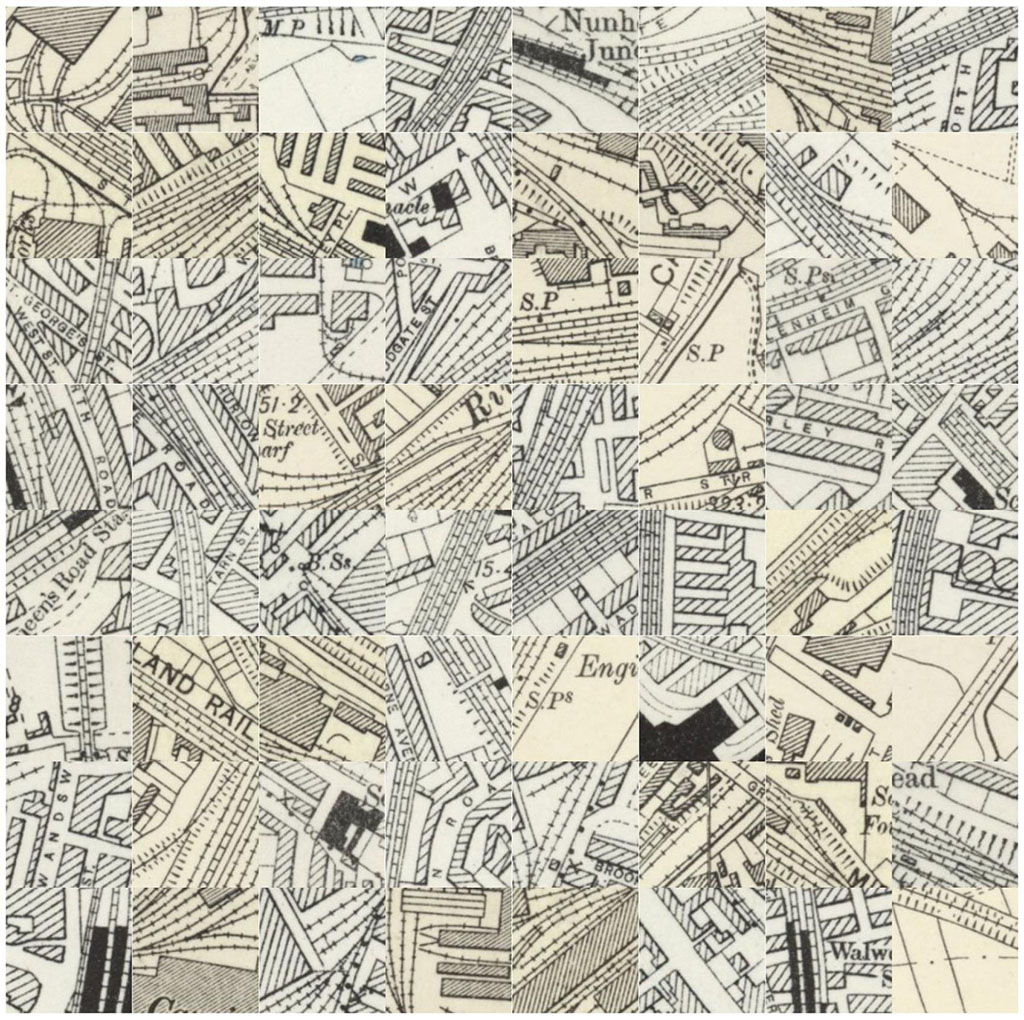
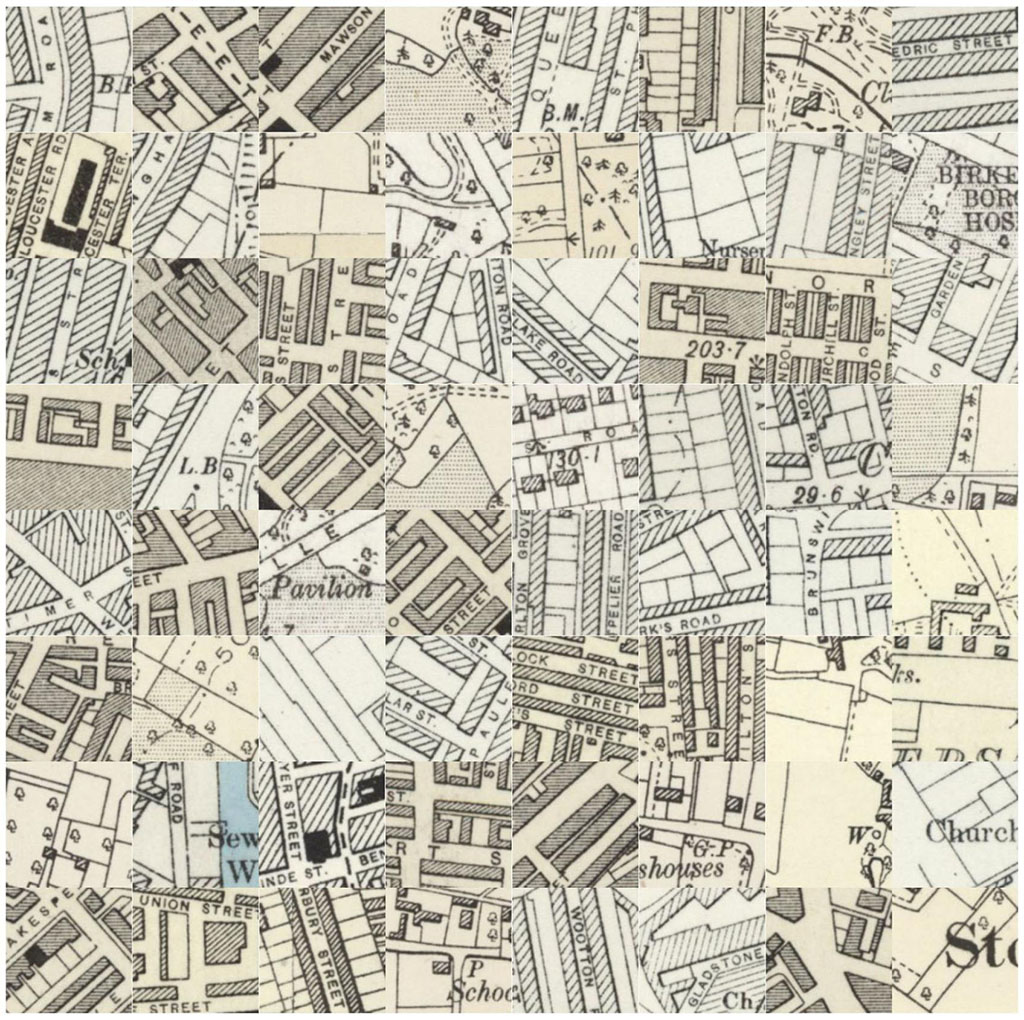
Figure 3: Example of MapReader patches classified as urban "railspace" and buildings.
Map Extraction and Reconstruction - Cartonomics
The Cartonomics research initiative at EPFL automatically extracts, classifies and correlates visual and textual features from large-scale historical map collections, by means of the latest AI techniques, such as neural network and transformer-based architectures. Cartonomics’ models are trained on datasets of more than 250.000 annotated map segments and 285.000 extracted text sequences from 19th-century European maps and major European cadastral series (cf. Lin et al. 2026), to reconstruct complex entities such as multi-word place names or composite cartographic symbols. These computational approaches transform maps into analyzable data layers, revealing and enabling the comparison of graphic conventions, symbolic grammars and spatial hierarchies across time and regions (Petitpierre et al. 2024). In this way, this work provides an empirical basis for a renewed understanding of cartographic languages, their diffusion, adaptation and transformation, through automated, multimodal analysis that goes well beyond traditional case-based map studies. Cartonomics’ technical pipeline can recognize and vectorize multiple layers of cartographic information that together describe both the graphic composition and the semantic content of historical maps.
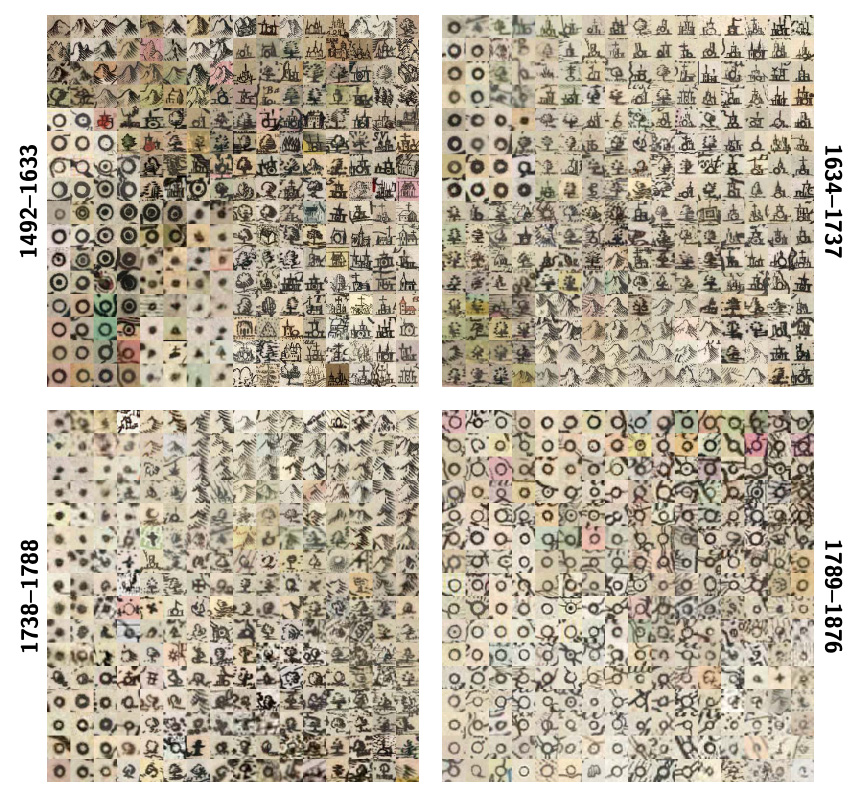
Figure 4: Examples of Cartonomics’ most frequent and characteristic cartographic signs extracted and compared across different time strata.
The Cartonomics pipeline performs semantic segmentation of base categories such as built, non-built and water-related areas, roads and administrative boundaries. Beyond these thematic layers, it also extracts typographic elements, such as map labels and toponyms, to reconstruct multi-word entities and align them with their corresponding geometries on the original maps. The pipeline also permits to detect graphical signs and pictorial symbols, such as hachures, contour lines and boundary markers, enabling the reconstruction of the symbolic grammar of particular cartographic traditions.
Through vectorization and spatial realignment, extracted elements can be further compared across map series and time periods, allowing the study of the evolution of visual mapping conventions. This makes it possible to trace the diffusion of cartographic languages: how particular symbolic systems, line codings and typographic norms circulated among mapmakers and institutions. From a historiographic perspective, such analyses reveal how cartographic practices encode assumptions on what was known about geographical territory, visibility and hierarchy in certain periods, and how engineers, surveyors and map publishers collectively constructed spatial knowledge.
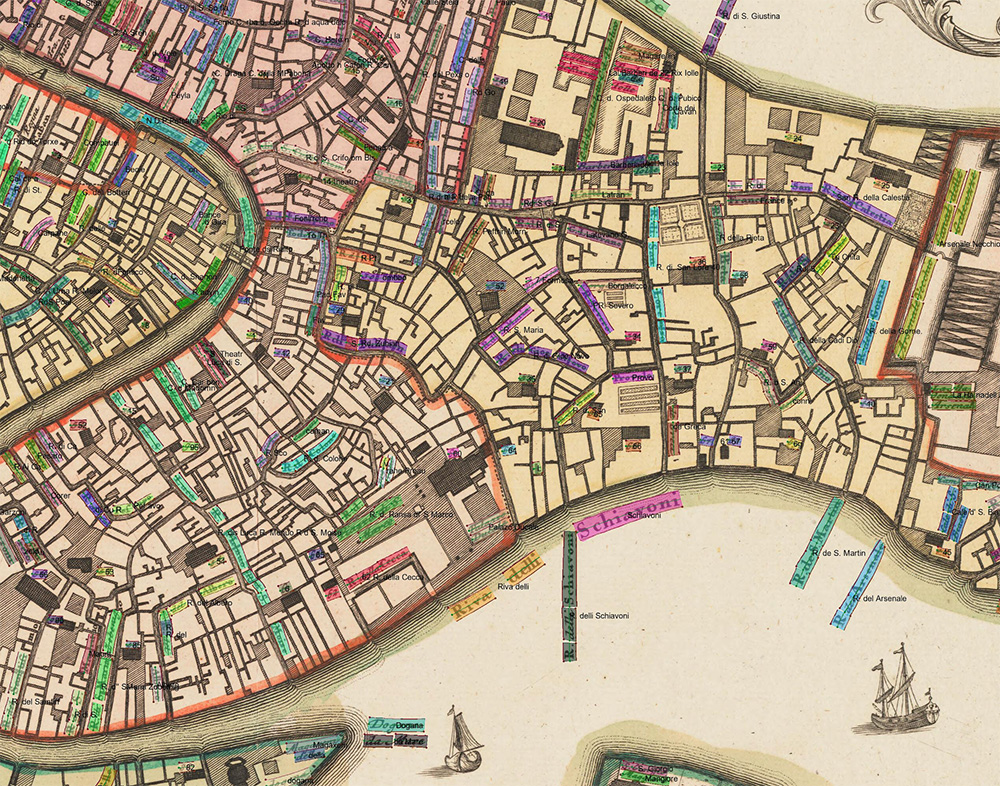
Figure 5: Examples of word detection and linking, highlighted with colored polygons, from Ludovico Ughi’s 1729 map of Venice.
The ways in which AI, computer vision and machine learning principles help expand analytical processes across large cartographic source collections can unlock the true research potential of this material. At the same time, this also comes with new epistemological trade-offs for researchers: new types of uncertainty are introduced, which can make historians feel rather uneasy about working with the produced data. How precise do large-scale classifications of map fragments for instance need to be, to base sound research results on? How much analytical certainty is required, from a humanities-based research perspective?
Increased digital availability and analysis of historical maps also introduces new opportunities to integrate and collaborate on holistic, multi-tool workflows and multi-source projects, in which the abovementioned interpretative trade-offs can be tackled in interdisciplinary teams. New, historically oriented research projects can be envisioned that bring all previously highlighted methodological and technical advancements into practice, around previously unexplored, inaccessible or incompatible archival sources. Three recent projects that illustrate this potential are the Dutch GLOBALISE and related Necessary Reunions project, the Belgian Artemis project and the French SoDUCo project.
Project Highlight I - GLOBALISE & Necessary Reunions
The GLOBALISE project aims to innovate research practices involving the archives of the Dutch East India Company (VOC), a dominant colonial power in the 17th and 18th centuries. The project’s primary goal is to create a new infrastructure that allows researchers to read, browse and query the millions of pages of written sources created by the VOC. These archives, housed in the Dutch National Archives, are crucial for new understandings of the histories of colonial expansion and local societies in maritime Asia and the Cape of Good Hope. However, all these written archival sources were originally intended to be used alongside visual materials, such as maps. Maps remain vital for understanding information about the places referenced in textual records, while these written sources, in turn, provide essential context that enriches cartographic knowledge (Van Wissen, Kuruppath & Petram 2025).
The Necessary Reunions project aims to reinstate this synergy between texts and maps into the VOC archives, focusing on a corpus of 30 maps of early modern Kerala, India. This project aims to integrate data from textual archives and maps to create two key outputs: a gazetteer and a website. The gazetteer will function as a structured digital directory of place information, including location data and historical toponyms. The website will allow users to visualize these data enrichments directly on the VOC maps.
To achieve this, the project employs several techniques, such as text spotting (using the MapReader pipeline) and handwritten text recognition to transcribe toponyms on maps into machine-readable text, and georeferencing (via Allmaps) to identify and assign modern coordinates to historical locations by comparing them with contemporary maps. Subsequently, identified places are linked to unique and persistent entries within the gazetteer. The resulting gazetteer and accompanying website will allow historians to better contextualize places and comprehend historical interactions. This provides vital context to better interpret the broader VOC archives, while enabling a reconceptualization of Kerala's early modern topography and supporting new histories of the region.
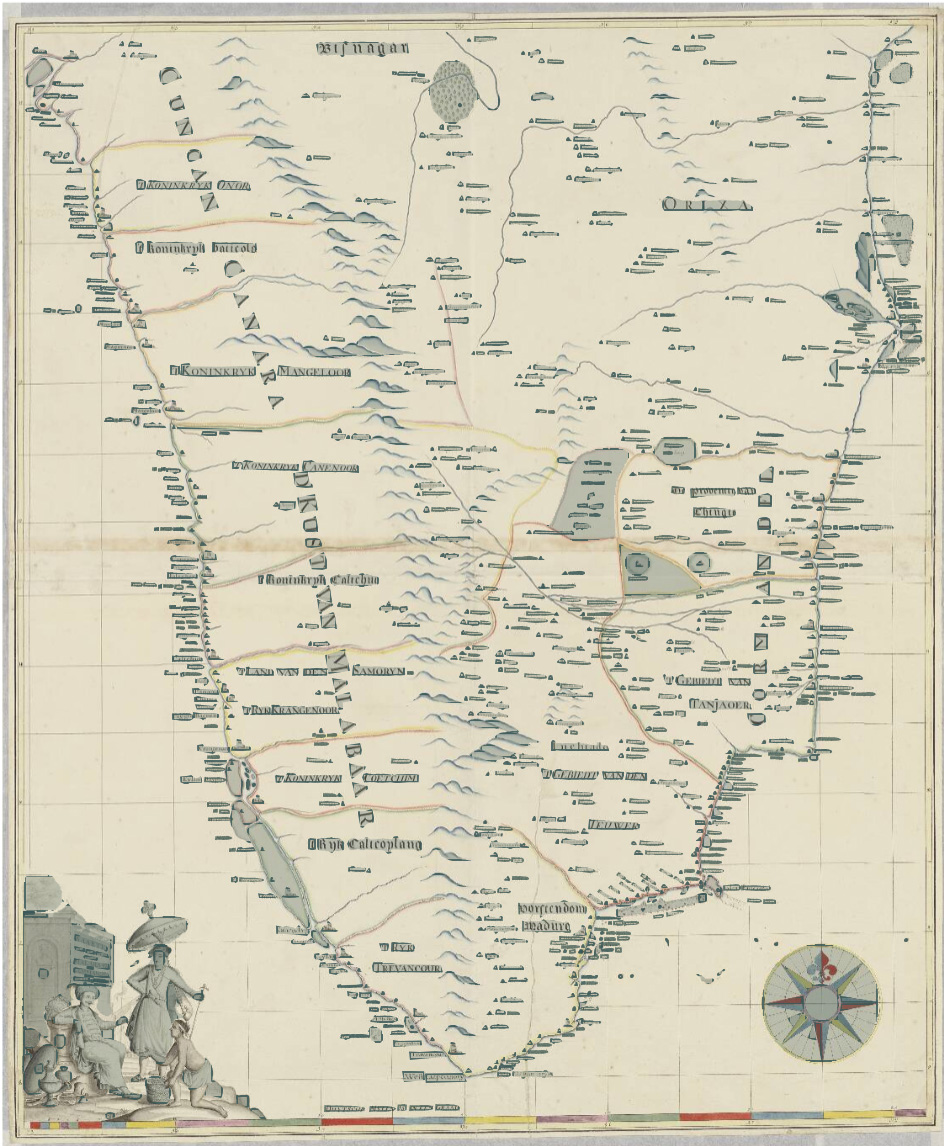
Figure 6: Annotated map of the South Coast of India (ca. 1752-1757), showing annotated and transcribed toponyms, annotated icons and reference points (from Dutch National Archives, NL-HaNA_4.MIKO_W37).
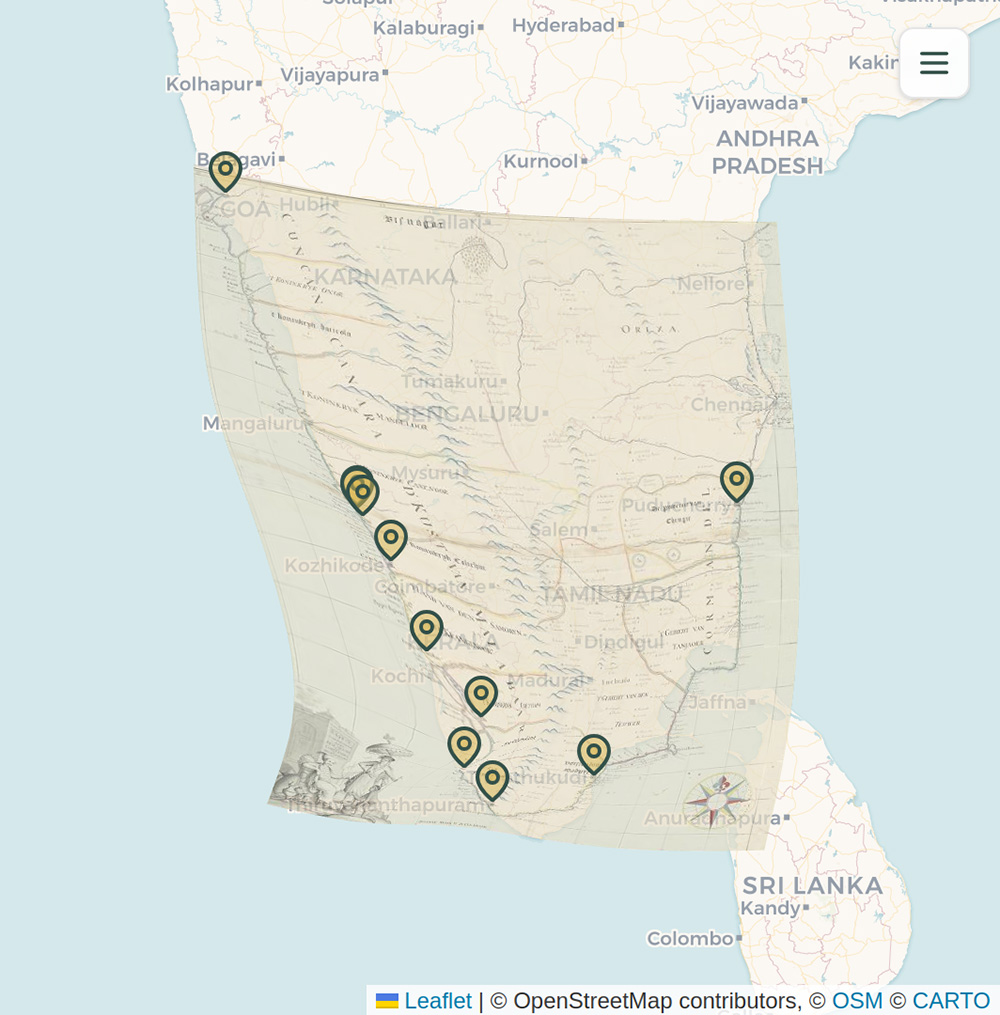
Figure 7: Georeferenced map of the South Coast of India (ca. 1752-1757), showing a transformed early modern map with ten control points, annotated using Allmaps (from Dutch National Archives, NL-HaNA_4.MIKO_W37).
Project Highlight II - Artemis
The Artemis project investigates how the Scheldt valley in Belgium, between Ghent and Antwerp, has changed over time. The river Scheldt has been shaped by centuries of human efforts to manage water and land. By studying historical maps, the project reveals how people used and engineered this dynamic environment throughout history, and how those past choices continue to shape the region today.
Run jointly by Ghent University and the University of Antwerp, and linked to the broader digital humanities research infrastructure of CLARIAH-VL, Artemis aims to make Belgium’s historical maps of the Scheldt valley digitally accessible and useful for research. It combines machine learning, citizen science and open data principles to build a new digital infrastructure for spatial and environmental research using these maps.
The project draws on key historical map series, including the Ferraris map, the primitive cadastre and the reduced cadastre (provided by the Royal Library of Belgium, the State Archives, the National Geographic Institute and Meise Botanical Garden), but also on unique handwritten older maps (as kept at the State Archives of Belgium and various city archives). Large-scale georeferencing is carried out via Allmaps and during public mapathons, while text extraction from the maps is performed using MapReader, with a fine-tuned text spotting model. For the historical cadastre, the project develops and tests feature extraction and parcel vectorization methods to identify and vectorize cadastral parcels on the primitive cadastral maps. The resulting datasets are being published as Linked Open Data, ensuring that other researchers and policymakers can reuse them to continue studying the Scheldt region’s environmental history and inform future land and water management.
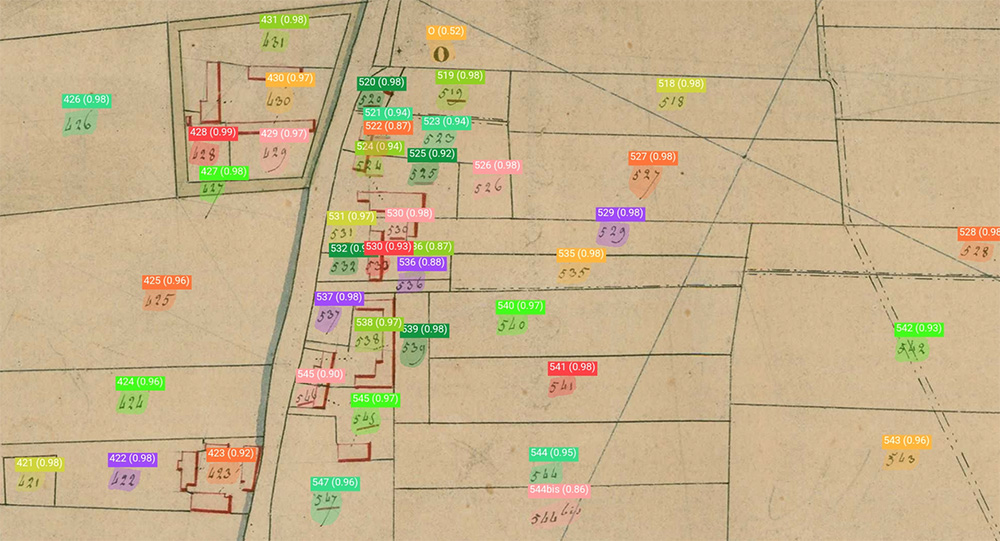
Figure 8: Example of parcel numbers detected on the primitive cadastral maps from the Artemis project.
Project Highlight III - SoDUCo
The SoDUCo project has devised methods and models for examining how urban spatial structures evolve alongside the professional practices of residents. Its case study has reconstructed developments of Paris from 1789 to 1950 using two complementary source collections. First, a collection of cartographic data has been used, generated from sixteen master maps together with the complete series of cadastral maps for Paris and its suburbs, documenting changes in road networks and the built environment. Second, a collection of directory data has also been used, compiled from trade directories covering the same period, which record Paris inhabitants’ occupations and social status at specific addresses.
By digitizing these rich resources through collaborative workflows, the project has introduced a qualitative leap for the historiography of Paris, namely to provide tools that allow researchers to trace, verify and refine information extracted from diverse historical materials. The project’s primary outcomes are an extensive open database on the social and urban history of Paris, and a collaborative geohistorical platform that enables users to further validate and enrich this database, as well as to let them explore and analyze socio-spatial evolution of the city.
During the project, several city atlases were georeferenced using Allmaps. Although the initial georeferencing was manual, further research steps aimed to automate both the georeferencing of new maps and the realignment of previously georeferenced ones. The control points derived from georeferencing were also used to locate more precise data, such as building footprints, extracted from the maps during vectorization processes. The project’s work still continues on improving these extraction pipelines and making them applicable to other map series. Throughout the entire project, the research team aimed to keep a detailed provenance of the sources and tools used at each step, a practice they considered essential for the reliability and scientific usability of the collected data. The project sources and their provenance have therefore been documented in a searchable catalog.
Conclusion
To conclude, new workflows for digitized historical cartographic material:
- focus on large-scale extraction of information from archival sources, both map collections themselves and related material;
- aim to automate mapping processes, such as vectorization, georeferencing and annotation of maps;
- increasingly adhere to open data standards such as IIIF, enabling more efficient, sustainable and open access and storage of cartographic sources and their metadata;
- and often start from smaller, compartmentalized cartographic elements, such as map patches and fragments, in order to extend analysis to large-scale map collections;
while new research directions for digitized historical cartographic material comprise:
- new topics and themes resulting from the linking and aggregating of previously scattered sources;
- new perspectives on well-known source material, through more extensive temporal or spatial scopes that now become more graspable for proper analysis;
- a focus on (re)discovering cartographic patterns and trends over time, be it related to local geographic developments or more global cartographic evolutions;
- and possibilities that extend beyond historical maps to other cartographic sources, such as aerial photography, satellite and drone imagery, and other material related to the fields of earth sciences, geodesy and engineering, to which Spatial Humanities and Spatial History can become more closely linked.
References
- Arnold, Taylor and Lauren Tilton. Distant Viewing: Computational Exploration of Digital Images. Cambridge: The MIT Press, 2023.
- Bodenhamer, David J., John Corrigan and Trevor M. Harris, eds. Deep Maps and Spatial Narratives. Bloomington & Indianapolis: Indiana University Press, 2015.
- Di Lenardo, Isabella, Raphaël Barman, Albane Descombes and Frédéric Kaplan.
“Repopulating Paris: Massive Extraction of 4 Million Addresses from City
Directories between 1839 and 1922.” Digital Humanities Conference, Utrecht, The Netherlands, July 9-12, 2019. https://doi.org/10.34894/MNF5VQ. - Graham, Shawn, Ian Milligan, Scott B. Weingart and Kim Martin. Exploring Big Historical Data: The Historian’s Macroscope (2nd ed.). London: World Scientific Publishing, 2022.
- Hanlon, Ann, Ian Spangler, Stephen Appel, Jules Schoonman, and Bert Spaan. “The Social Life of Allmaps: Reflecting on Software Communities in Sustaining the Digital Geohumanities.” Journal of Map & Geography Libraries 21 (3), 2025. 156–63. https://doi.org/10.1080/15420353.2025.2574896
- Hermenault, Léa. “The Belgian Historical Gazetteer: An Index of Belgian Historical Place Names to Link Archival Collections and Explore Landscapes Histories.” CLARIAH-VL, 2024. https://doi.org/10.58079/12p8q.
- Hosseini, Kasra, Daniel C. S. Wilson, Kaspar Beelen and Katherine McDonough. “MapReader: A Computer Vision Pipeline for the Semantic Exploration of Maps at Scale.” GeoHumanities ‘22: Proceedings of the 6th ACM SIGSPATIAL International Workshop on Geospatial Humanities, Seattle, United States, November 1, 2022. Eds. L. Moncla, B. Martins and K. McDonough. New York: Association for Computing Machinery, 2022. 8-19. https://doi.org/10.1145/3557919.3565812.
- Lin, Yijun, Solenn Tual, Zekun Li, Leeje Jang, Yao-Yi Chiang, Jerod Weinman, Joseph Chazalon, Edwin Carlinet, Julien Perret, Nathalie Abadie, Bertrand Duménieu, Ta-Chien Chan, Hsiung-Ming Liao, Wen-Rong Su, Mengjie Zou, Tianhao Dai, Rémi Petitpierre, Beatrice Vaienti, Frédéric Kaplan, Isabella Di Lenardo, Youngmin Baek, Michael Hentschel, Yu Nakagome, Ichimura Shuta, Jeongtae Lee and Chankyu Choi. “ICDAR 2025 Competition on Historical Map Text Detection, Recognition, and Linking.” Document Analysis and Recognition – ICDAR 2025, Proceedings, Part V, Wuhan, China, September 16-21, 2025. Eds. X.-C. Yin, D. Karatzas and D. Lopresti. Cham: Springer, 2026. 568-85. https://doi.org/10.1007/978-3-032-04630-7_33.
- McDonough, Katherine, Kaspar Beelen, Daniel C. S. Wilson and Rosie Wood. “Reading Maps at a Distance: Texts on Maps as New Historical Data.” Imago Mundi 76.2 (2024): 296-307. https://doi.org/10.1080/03085694.2024.2453336.
- Meijers, Martijn, and Jules Schoonman. “Mapping the Edge: A Novel Approach to Georeferencing Historical Map Series.” 18th ICA Conference Digital Approaches to Cartographic Heritage, Bologna, Italy, October 23-25, 2024. Eds. A. Tsorlini and C. Boutoura. Thessaloniki: CartoGeoLab, 2024. 268-80. https://www.gdmc.nl/publications/2024/GeorefHistMapSeries.pdf.
- Moretti, Franco. Distant Reading. London & New York: Verso, 2013.
- Nelson, Robert K. “Mapping Environmental Inequalities: Using MapReader to Uncover Mid-Century Industrial Burdens.” Imago Mundi 76.2 (2024): 284-90. https://doi.org/10.1080/03085694.2024.2453333.
- Noordegraaf, Julia, Marieke van Erp, Richard Zijdeman, Mark Raat, Thunnis van Oort, Ivo Zandhuis, Thomas Vermaut, Hans Mol, Nicoline van der Sijs, Kristel Doreleijers, Vincent Baptist, Charlotte Vrielink, Brenda Assendelft, Claartje Rasterhoff and Ivan Kisjes. “Semantic Deep Mapping in the Amsterdam Time Machine: Viewing Late 19th- and Early 20th-Century Theatre and Cinema Culture through the Lens of Language Use and Socio-Economic Status.” Research and Education in Urban History in the Age of Digital Libraries (UHDL), Dresden, Germany, October 10-11, 2019. Eds. F. Niebling, S. Münster and H. Messemer. Cham: Springer, 2021. 191-212. https://doi.org/10.1007/978-3-030-93186-5_9.
- Petitpierre, Rémi, Johannes H. Uhl, Isabella Di Lenardo and Frédéric Kaplan. “A Fragment-Based Approach for Computing the Long-Term Visual Evolution of Historical Maps.” Humanities and Social Sciences Communications 11 (2024): 1-18. https://doi.org/10.1057/s41599-024-02840-w.
- Presner, Todd, David Shepard and Yoh Kawano. HyperCities: Thick Mapping in the Digital Humanities. Cambridge: Harvard University Press, 2014.
- Rhodes, Joshua, Jon Lawrence, Kaspar Beelen, Katherine McDonough and Daniel C. S. Wilson. “Beyond the Tracks: Re-Connecting People, Places and Stations in the History of Late-Victorian Railways.” Living with Machines: Computational Histories of the Age of Industry. Eds. R. Ahnert, E. Griffin and J. Lawrence. London: University of London Press, 2025 [Pre-review version, October 2025]. https://doi.org/10.14296/xdyp6338.
- Van Wissen, Leon, Manjusha Kuruppath and Lodewijk Petram. “Unlocking the Research Potential of Early Modern Dutch Maps.” European Journal of Geography 16.1 (2025): 12-17. https://doi.org/10.48088/ejg.si.spat.hum.l.wis.12.17.
- Wood, Rosie, Kasra Hosseini, Kalle Westerling, Andrew Smith, Kaspar Beelen, Daniel C. S. Wilson and Katherine McDonough. “MapReader: Open Software for the Visual Analysis of Maps.” Journal of Open Source Software 9.101 (2024). https://doi.org/10.21105/joss.06434.